Statistics Learning for Data Science-2 of N ( T test, Z test , F test)
Hypothesis Testing
From http://www.statisticshowto.com/when-to-use-a-t-score-vs-z-score/
---
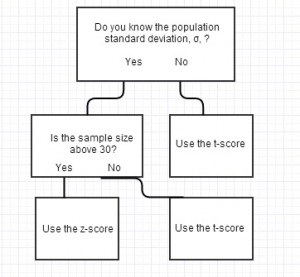
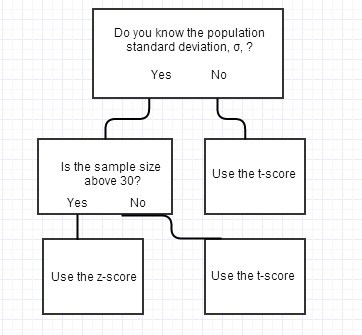
A z-score and a t score are both used in hypothesis testing. Few topics in elementary statistics cause more confusion to students than deciding when to use the z-score and when to use the t score. Generally, in elementary stats and AP stats, you’ll use a z-score in testing more often than a t score.
Note:You can estimate the population standard deviation, σ by using the standard deviation of the sample, s. However, you can only do this if your sample is 30 or above.

The z-score is calculated using the formula:
z=(X-μ)/σ, where σ is the population standard deviation and μ is the population mean.
The z-score formula doesn’t say anything about sample size; The rule of thumb applies that your sample size should be above 30 to use it.
If your sample is 30 or above, you can estimate σ with the sample standard deviation, s. The z-score formula becomes:
z=(X-μ)/s;
T= t = (x – μx) / [ s/√(n) ].
Where Xbar is the sample mean and s is the standard deviation of the sample.
-----------------------------
Lets try to solve few problems
a) In my city a new fast food restaurant is opening, the owner assumes there will be a demand for it.
Suppose they would like to determine if the typical amount spent per customer for dinner at a new restaurant is more than INR 300. A sample of 49 customers over a week period were sample and average spent was 330. Assume that the standard deviation is known to be INR 25.00.
Using a 0.02 level of significance(Table value -2.06 to 2.06),
Would we conclude that the typical amount spent per customer is more than 300?
Ans:
The question translates to a hypothesis Test about a population mean , The sample size is large (>30), hence lets calculate the z score
Z score= (Sample Mean(SM) - Hypothesized Population Mean(HPM) )/ STDV/SQRT(SAMPLE Size)
= (330-300)/25/SQRT(49)
= -30/25/7
= -30/3.57
=-8.4
From Tables, we see. we can accept the null hypothesis if z score is with in -2.06 to 2.06.
Hence in this case, we reject the null hypothesis.
b)
Suppose an editor of a publishing company claims that the mean time to write a textbook is at most 15 months. A sample of 16 textbook authors is randomly selected and it is found that the mean time taken by them to write a textbook was 12.5. Assume also that the standard deviation is known to be 3.6 months. Assuming the time to write a textbook is normally distributed and using a 0.025 level of significance(Table value is between -1.96 to 1.96), would you conclude the editor’s claim is true?
The question translates to a hypothesis Test about a population mean , The sample size is samll (<30), hence lets calculate the t score
T score= (Sample Mean(SM) - Hypothesized Population Mean(HPM) )/ STDV/SQRT(SAMPLE Size)
= 12.5-15/3.6(SQRT(16)
=-2.5/3.6/4
=-2.77
Since score is beyond table value range of -1.96 to 1.96, the hypothesis rejected.
c)
The question translates to a hypothesis Test about a population mean , The sample size is samll (<30), hence lets calculate the t score
T score= (Sample Mean(SM) - Hypothesized Population Mean(HPM) )/ STDV/SQRT(SAMPLE Size)
d)r
research was conducted to understand the attititude of women towards politic, as per literature survey it shows that women have greater variation than men. study tends to understand collected indepedent sample from 2 states with sample size of 60 each.after calculation of views,its found that the sample variance for men is 80 and women is 120.
Test the difference attititude towards politics at 5% level of significance. table value between -1.96 to 1.96
Since 2 diff independent samples...use F stats.
The F-test is designed to test if two population variances are equal. It does this by comparing the ratio of two variances. So, if the variances are equal, the ratio of the variances will be 1.

F=120/80=1.5
F from table is -1.96 to 1.96..
So lets accept Ho.
e)
From http://www.statisticshowto.com/when-to-use-a-t-score-vs-z-score/
---
A z-score and a t score are both used in hypothesis testing. Few topics in elementary statistics cause more confusion to students than deciding when to use the z-score and when to use the t score. Generally, in elementary stats and AP stats, you’ll use a z-score in testing more often than a t score.
T-score vs. z-score: When to use a t score
The general rule of thumb for when to use a t score is when your sample size meets the following two requirements:- The sample size is below 30
- The population standard deviation is unknown (estimated from your sample data)
Note:You can estimate the population standard deviation, σ by using the standard deviation of the sample, s. However, you can only do this if your sample is 30 or above.
When to know if you should use a t score vs. z score
T-Score vs. Z-Score: z-score
Technically, z-scores are a conversion of individual scores into a standard form. The conversion is based on your knowledge about the population’s standard deviation and mean. A z-score tells you how many standard deviations from the mean your result is. You can use your knowledge of normal distributions (like the 68 95 and 99.7 rule) or the z-table to determine what percentage of the population will fall below or above your result.The z-score is calculated using the formula:
z=(X-μ)/σ, where σ is the population standard deviation and μ is the population mean.
The z-score formula doesn’t say anything about sample size; The rule of thumb applies that your sample size should be above 30 to use it.
If your sample is 30 or above, you can estimate σ with the sample standard deviation, s. The z-score formula becomes:
z=(X-μ)/s;
T-Score vs. Z-Score: t-score
Like z-scores, t-scores are also a conversion of individual scores into a standard form. However, t-scores are used when the conversion is made without knowledge of the population standard deviation and mean. Seeing as you don’t know those parameters for your population, you make an estimate by using the statistics from your sample.T= t = (x – μx) / [ s/√(n) ].
Where Xbar is the sample mean and s is the standard deviation of the sample.
-----------------------------
Lets try to solve few problems
a) In my city a new fast food restaurant is opening, the owner assumes there will be a demand for it.
Suppose they would like to determine if the typical amount spent per customer for dinner at a new restaurant is more than INR 300. A sample of 49 customers over a week period were sample and average spent was 330. Assume that the standard deviation is known to be INR 25.00.
Using a 0.02 level of significance(Table value -2.06 to 2.06),
Would we conclude that the typical amount spent per customer is more than 300?
Ans:
The question translates to a hypothesis Test about a population mean , The sample size is large (>30), hence lets calculate the z score
Z score= (Sample Mean(SM) - Hypothesized Population Mean(HPM) )/ STDV/SQRT(SAMPLE Size)
= (330-300)/25/SQRT(49)
= -30/25/7
= -30/3.57
=-8.4
From Tables, we see. we can accept the null hypothesis if z score is with in -2.06 to 2.06.
Hence in this case, we reject the null hypothesis.
b)
Suppose an editor of a publishing company claims that the mean time to write a textbook is at most 15 months. A sample of 16 textbook authors is randomly selected and it is found that the mean time taken by them to write a textbook was 12.5. Assume also that the standard deviation is known to be 3.6 months. Assuming the time to write a textbook is normally distributed and using a 0.025 level of significance(Table value is between -1.96 to 1.96), would you conclude the editor’s claim is true?
The question translates to a hypothesis Test about a population mean , The sample size is samll (<30), hence lets calculate the t score
T score= (Sample Mean(SM) - Hypothesized Population Mean(HPM) )/ STDV/SQRT(SAMPLE Size)
= 12.5-15/3.6(SQRT(16)
=-2.5/3.6/4
=-2.77
Since score is beyond table value range of -1.96 to 1.96, the hypothesis rejected.
c)
Suppose, according to a 2011 demographic report,
the average Indian
household spends Rs 90 per day.Suppose
you recently took a random sample of 30 households in Delhi and the results revealed a mean of Rs84.50. Suppose the standard deviation
is known to be Rs14.50. Using a 0.05
level of significance(table value between -1.65 to 1.65), can it be concluded that the average amount spent per
day by Indian
households has decreased?
The question translates to a hypothesis Test about a population mean , The sample size is samll (<30), hence lets calculate the t score
T score= (Sample Mean(SM) - Hypothesized Population Mean(HPM) )/ STDV/SQRT(SAMPLE Size)
=84-5-90/14.5/sqrt(30)
=-2.078
Reject Ho if Z < -1.65
Reject Ho
There is sufficient evidence to
conclude the average amount spent per day by U.S. households has decreased, α =
0.05.
d)r
research was conducted to understand the attititude of women towards politic, as per literature survey it shows that women have greater variation than men. study tends to understand collected indepedent sample from 2 states with sample size of 60 each.after calculation of views,its found that the sample variance for men is 80 and women is 120.
Test the difference attititude towards politics at 5% level of significance. table value between -1.96 to 1.96
Since 2 diff independent samples...use F stats.
The F-test is designed to test if two population variances are equal. It does this by comparing the ratio of two variances. So, if the variances are equal, the ratio of the variances will be 1.
F=120/80=1.5
F from table is -1.96 to 1.96..
So lets accept Ho.
e)


Comments
Post a Comment